Optimized for social media posting
English | Spanish | French | Chinese | Russian | Arabic |
English | Spanish | French | Chinese | Russian | Arabic |
English | Spanish | French | Chinese | Russian | Arabic |
English | Spanish | French | Chinese | Russian | Arabic |
English | Spanish | French | Chinese | Russian | Arabic |
English | Spanish | French | Chinese | Russian | Arabic |
English | Spanish | French | Chinese | Russian | Arabic |
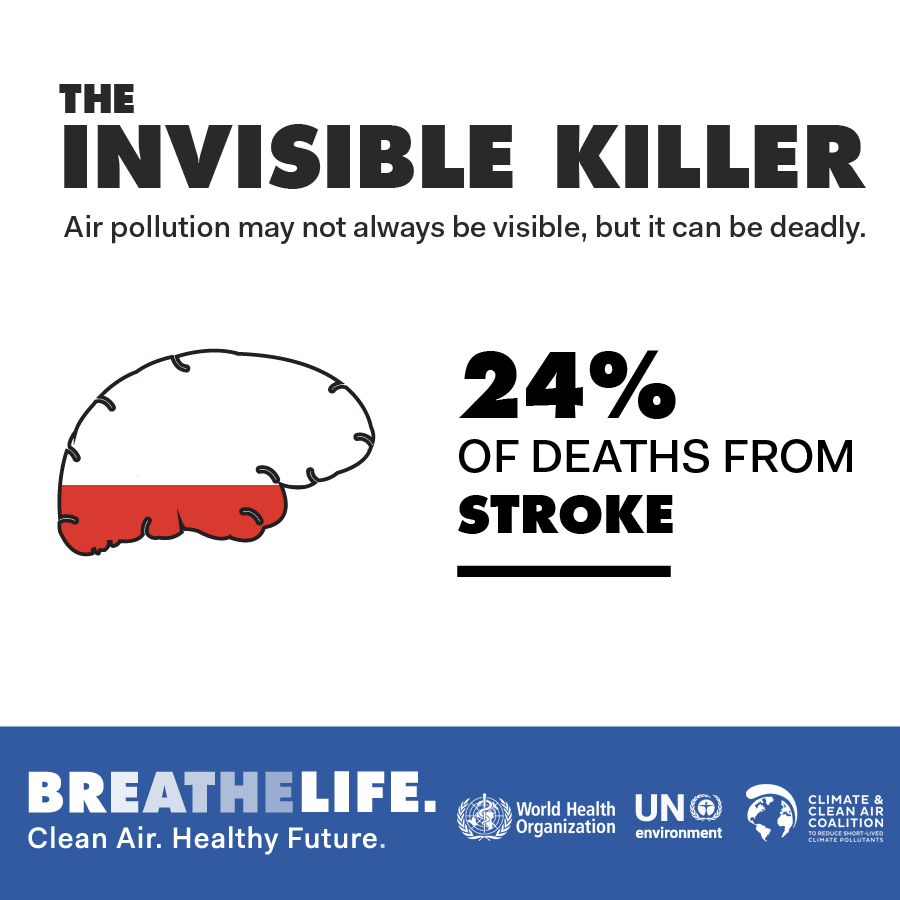
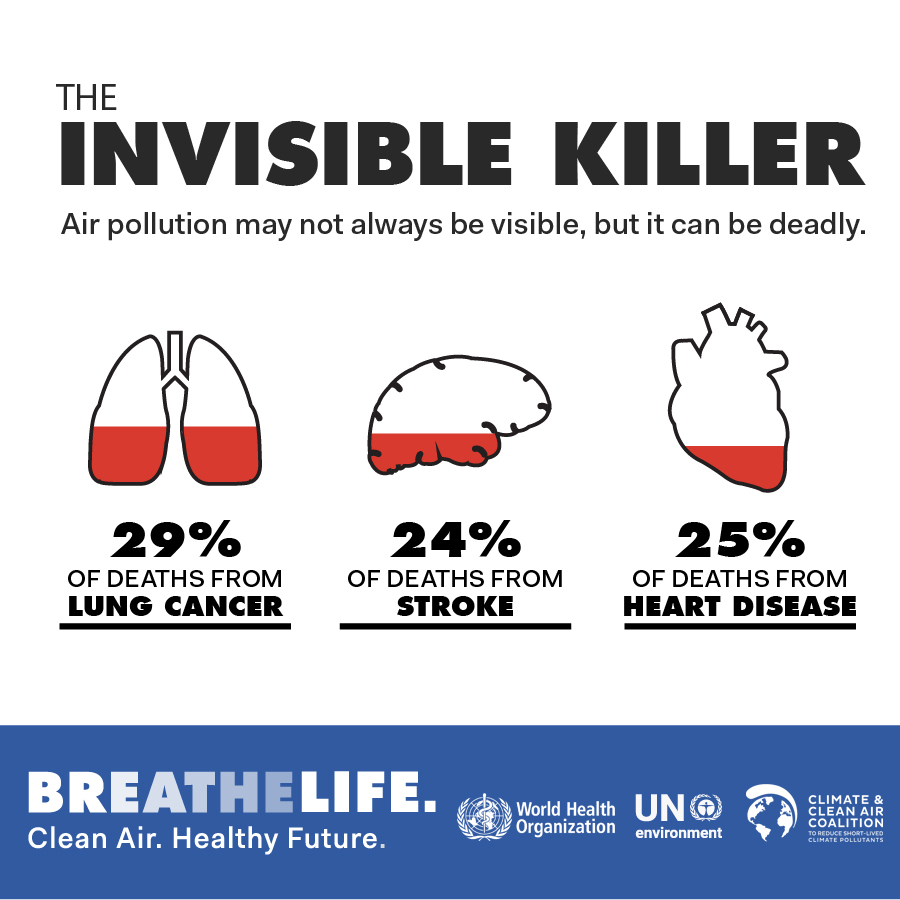
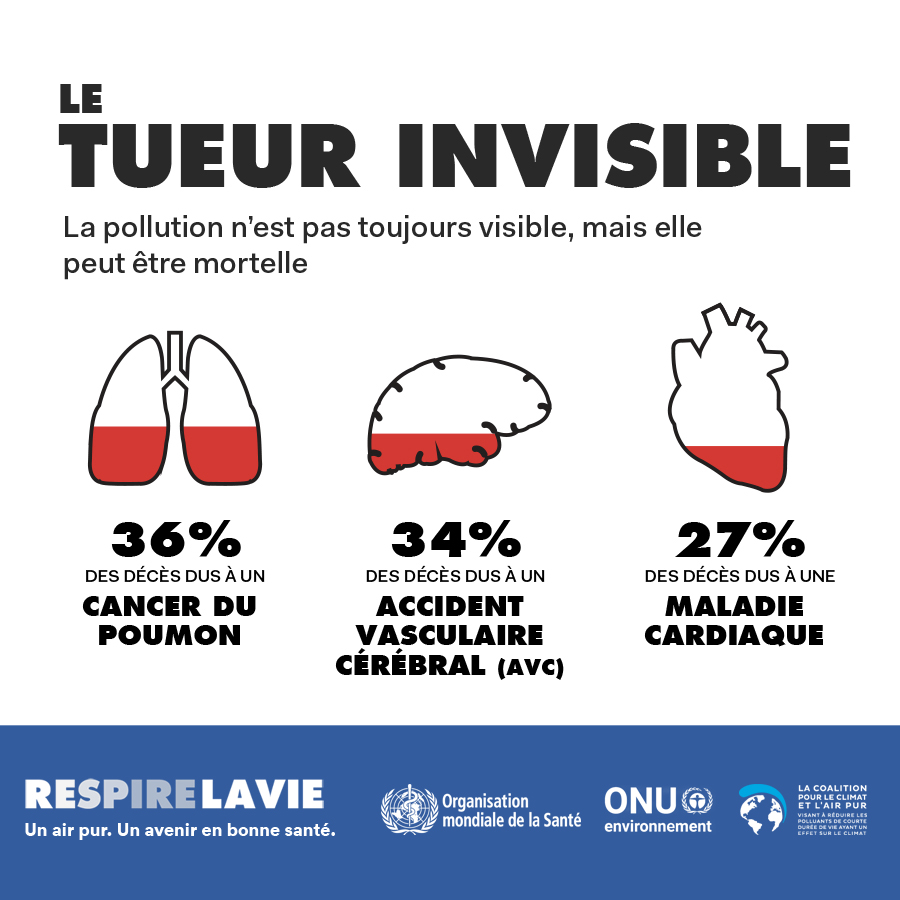
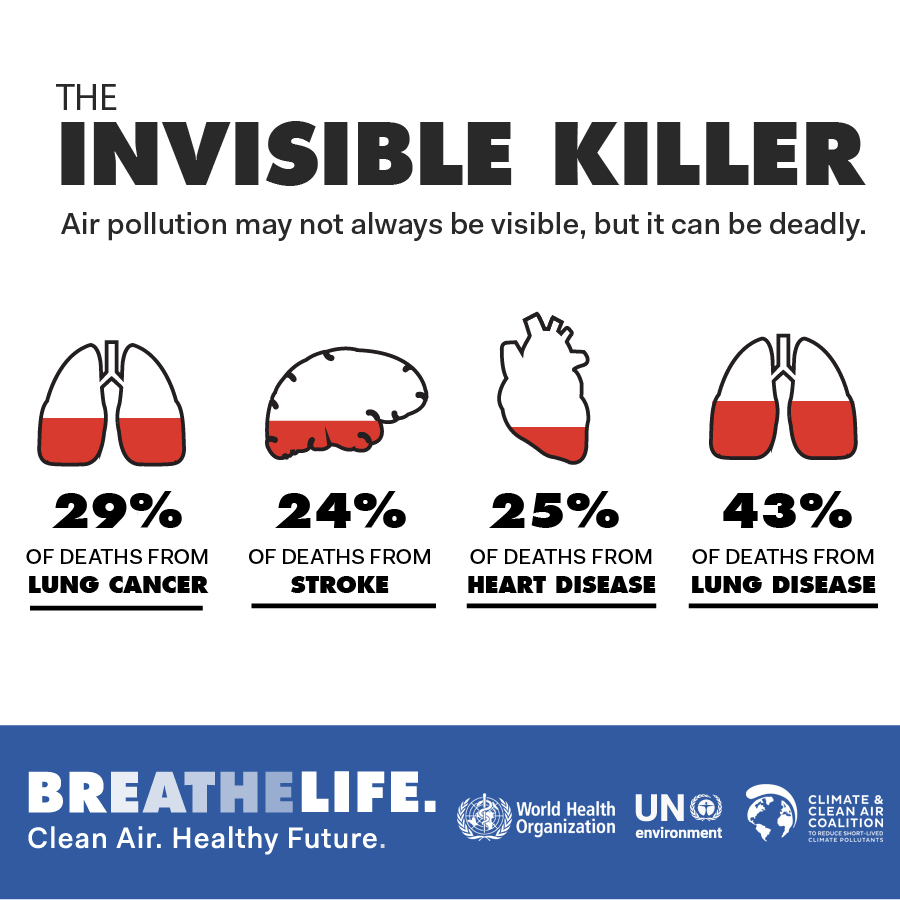
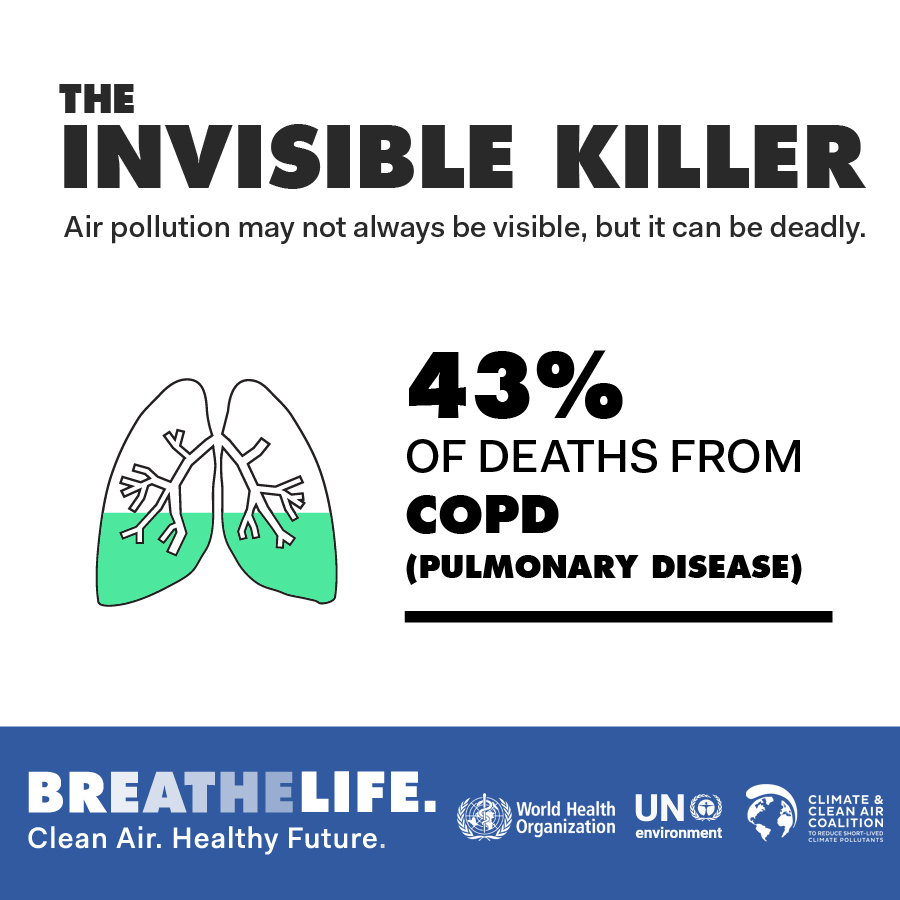
Stroke | COPD | Lung Cancer | Heart Disease
BreatheLife: I don’t drive during rush hour
BreatheLife: I walk to work
BreatheLife: I drive an electric vehicle
BreatheLife: I compost my waste
BreatheLife: I recycle my waste
BreatheLife: I don’t burn waste
BreatheLife: I use renewable energy to power my home
BreatheLife: I use clean energy to cook
BreatheLife: I check daily air pollution levels
BreatheLife: I turn off lights and electronics not in use