*Updated on 28 October 2019 with quotes from Google made at World Air Quality Conference in London
If you work in or with a city, and you think your city could use help measuring, planning and reducing overall carbon emissions, Google wants to hear from you.
“More than 10,000 cities around the world have committed to taking action on climate change over the next decade. But without the right data, it can be hard to know where to start,” the technology giant states in a blog post.
Last week, it launched a new, free online tool in five European cities: the Environmental Insights Explorer (EIE), designed in collaboration with the Global Covenant of Mayors for Climate & Energy, whose 10,000 member cities pledged at the Climate Action Summit in September to focus on achieving safe air quality and aligning climate change and air pollution policies by 2030.
Manchester, Dublin, Birmingham, Wolverhampton and Coventry are now using the EIE, which analyses Google’s global mapping data to estimate carbon emissions from building and transportation and renewable energy potential.
This data can then help cities build policies, guide solutions and measure progress, a point made by Program Manager at Google, Karin Tuxen-Bettman in London at the World Air Quality Conference on 23 October 2019.
“People have said, ‘why hyperlocal mapping, why this street-by-street mapping, what does it give you?’. Talking to cities, it’s boiled down to three things.
“This kind of hyperlocal information allows cities to make and pinpoint policy changes— they know where to start, they know that this corridor needs the electric bus first, or they know that certain areas need charging stations to incentivise and get people excited and inspiring people to go EV more than that neighbourhood, or starting with one neighbourhood over another,” she said.
But that policy response takes time to implement and yield results; in the meantime, hyperlocal mapping helps in adapting responses.
“It is really helping to reduce exposure, whether you choose to reduce exposure for your youngest or oldest city dwellers… you’ll be able to relocate playgrounds, for example,” she added.
“Finally, it helps people connect street by street— that’s my street, or that’s my mom’s street— and I know now why this mayor or team or city council is enacting this policy… that kind of power of these maps really helps bring the public along with the city,” she continued.
According to Google, in Dublin, city leaders have already been testing the tool, and are using EIE insights to inform smart transit programs with the goal of reducing emissions and increasing the use of cleaner modes of travel.
“Now we can bring Environmental Insights Explorer data analytics to conversations about transportation greenhouse gas emissions and show people the impact of supporting such programs to help start reducing emissions for our entire city which can help inform the debate,” said Dublin City Council’s Chief Executive, Owen Keegan.
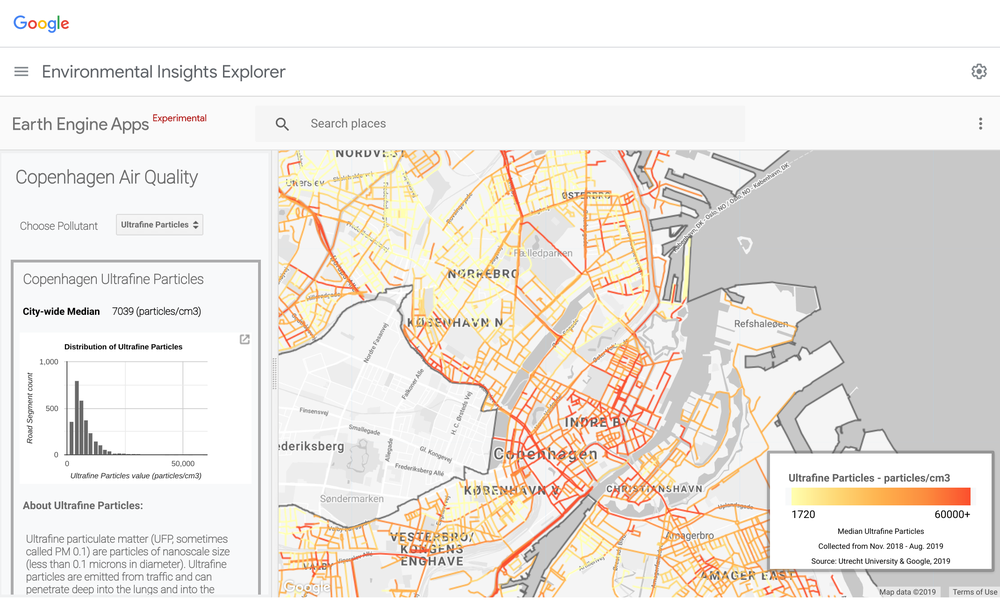
In Copenhagen, a new section of the tool, EIE Labs, focuses on making available hyperlocal, street-level air quality data, gathered through equipping Google’s Street View cars with fast-response, laboratory-grade instruments to precisely measure pollution concentrations every few seconds, Monday to Friday, during daytime hours.
The results shown are estimates of median pollution concentration for each street.
The EIE team is working with the City of Copenhagen and scientists at Utrecht University to create Copenhagen’s new air quality map, which shows block-by-block concentrations of black carbon and ultrafine particle pollution, which it says Copenhagen is already using to work with architects and designers to rethink the city for the future.
“With this new data, the city of Copenhagen can see for the first time pollutant levels of air quality at the ultrafine particle level on the roads in the city centre, as well as leading into the city centre, that are contributing the most to the city’s air pollution problems,” an official of the city of Copenhagen told the BBC.
“Measuring ultrafine particles and black carbon at street level are important steps for the City of Copenhagen to understand how we can prioritise actions to secure a clean and healthy city for our citizens. This new data displays the dynamic levels of ultrafine particles and black carbon with a strong overall relation to traffic patterns, but also hotspots like the narrow streets in our old city centre,” said senior developer at the Copenhagen Solutions Lab, City of Copenhagen, Rasmus Reeh.
The same human processes that cause climate change also release health-harmful air pollutants, so aligning policies on both greenhouse gas emissions and air pollution reaps immediate health benefits while heading off a wide range of primary and knock-on health impacts of climate change.
Cities consume over two-thirds of the world’s energy and account for more than 60 per cent of global carbon dioxide emissions, according to UN HABITAT, while the WHO found that outdoor air pollution causes 4.2 million premature deaths each year around the world.
Google is calling for cities around the world to nominate themselves for the project.
“We’re already working hard to bringing EIE to many more cities around the world, and we’re excited about helping more mayors create a healthier, cleaner future for their citizens and for the planet,” it said.
Take a look at Google’s Environmental Insights Explorer here.
Read the blog announcement on EIE’s Europe launch here: Fighting climate change with new data
Banner image from Google EIE labs
